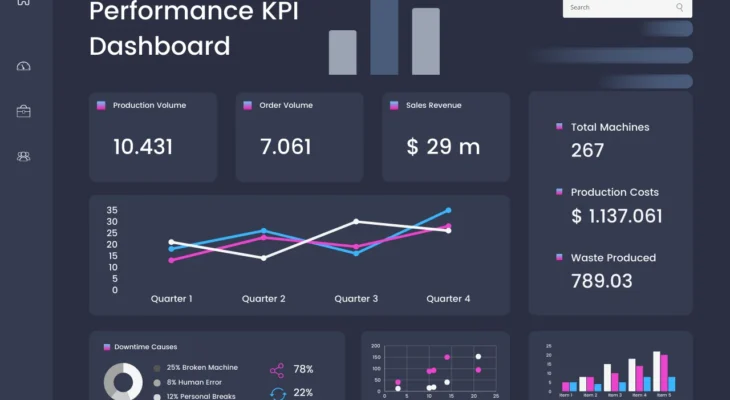
In the fast-paced world of telecommunications, the ability to swiftly analyze and respond to network performance data can be the difference between leading the market and lagging behind. Business Intelligence (BI) dashboards serve as a critical tool in this dynamic environment, providing a visual representation of complex data to help telecom companies make informed decisions quickly. This article delves into the essential Key Performance Indicators (KPIs) that should be integrated into telecom BI dashboards to optimize network performance effectively.
Understanding the Role of BI Dashboards in Telecom
BI dashboards in telecommunications are advanced analytical platforms that aggregate, analyze, and visualize key data points about network performance. These dashboards are designed to help network operators and managers monitor real-time data, identify trends, troubleshoot issues, and improve service quality. The integration of specific, relevant KPIs into these dashboards is crucial for effective monitoring and optimization.Essential KPIs for Telecom BI Dashboards
1. Network Availability
Network availability is a fundamental KPI that measures the percentage of time a network is available to users without any problems. High availability is critical for customer satisfaction and retention. According to a study by the Ponemon Institute, the average cost of network downtime is approximately $5,600 per minute, which underscores the importance of this KPI in maintaining a profitable and reliable service.
2. Signal Strength
Signal strength directly impacts the quality of service experienced by the end-users. It affects call quality, data transfer speeds, and overall user satisfaction. Monitoring this KPI helps in pinpointing areas with weak signals and addressing them proactively.
3. Data Traffic
Data traffic analysis provides insights into the usage patterns and demands on the network. By monitoring this KPI, telecom companies can manage their resources more efficiently, plan for capacity upgrades, and avoid network congestion. A report by Cisco Annual Internet Report (2018-2023) highlights that global mobile data traffic is expected to multiply by nearly seven times between 2017 and 2022, making this KPI more relevant than ever.
4. Latency
Latency measures the time it takes for a data packet to travel from the source to the destination. Lower latency enhances user experience, particularly in real-time communications and streaming services. As per a survey by Ericsson, reducing latency is crucial for improving the performance of interactive and emerging technologies like virtual reality (VR) and augmented reality (AR).
5. Packet Loss
Packet loss indicates the percentage of packets that are sent from the source but do not reach their intended destination. High packet loss can severely affect the quality of VoIP calls and video streaming. Monitoring and minimizing packet loss is essential for maintaining service quality.
6. Throughput
Throughput, the rate at which data is successfully delivered over a network, is vital for assessing the network’s capacity and performance. It helps in understanding how effectively the network handles data under different conditions.
7. Error Rate
The error rate is the number of errors in the data packets received over a network, indicating the integrity of the network transmission. A lower error rate generally means a more reliable connection.Implementing KPIs in BI Dashboards.
To effectively utilize these KPIs, telecom companies must integrate them into their BI dashboards in a way that is clear and actionable. Dashboards should be customizable to reflect the priorities and needs of different users, from technical staff to executive management. Real-time data visualization tools, like graphs and heat maps, can help in quickly identifying issues and trends.
Conclusion
In conclusion, optimizing network performance in the telecommunications industry requires a strategic approach to data analysis. BI dashboards, enriched with essential KPIs like network availability, signal strength, data traffic, latency, packet loss, throughput, and error rate, provide a comprehensive view of network health. These tools empower telecom companies to make data-driven decisions, enhancing service quality and customer satisfaction. As the demand for seamless and high-speed connectivity grows, the role of effective BI dashboards becomes increasingly critical in maintaining a competitive edge in the telecom industry.

